
The data analytics lifecycle is the foundation of every successful data-driven decision in 2025, guiding you everything about the organization through a structured process from data collection to actionable insights. As the volume of data continues to grow in a continuous flow, understanding this lifecycle has become crucial for businesses aiming to stay competitive.
In this blog, we will explore what the data analytics lifecycle is, the tools involved, key phases, common challenges, and how following it can improve outcomes from the lifecycle flow of data analytics.
What Is The Data Analytics Lifecycle?
The data analytics lifecycle is a step-by-step process which is used to analyze data and extract valuable terms that drive smart business decisions. It provides a structured approach for managing data from the initial discovery phase to the final delivery of results. In 2025, as businesses continue to rely heavily on data for the decision making, understanding this lifecycle has become more important than ever.
At its core the data analytics lifecycle helps organizations make sense of raw data. It typically includes several key stages: data discovery, data preparation, modeling, evaluation, and deployment. Each phase plays an important role in ensuring that the complete analysis is accurate, efficient, and aligned with business goals or need.
Whether you are working in marketing, finance, healthcare, or any other industry, following a proper data analytics lifecycle covers required consistency, repeatability, and improved outcomes. It allows working professionals like data analysts, data scientists, and business leaders to work properly with less errors.
The lifecycle is not a one-time activity. Instead, it is an ongoing process where feedback from results helps refine models and improve future analyses. As tools and technologies evolve in 2025, the data analytics lifecycle has also adapted which become more automated, scalable, and according to the end users.
In short the DA lifecycle is the blueprint for turning raw data into business intelligence. Mastering its phases is essential for anyone looking to succeed in the data-driven world.
Tools Used in Data Analytics Lifecycle
The data analytics lifecycle covers different tools at each phase. These tools help helps individual to collect, clean, analyze, and visualize data properly. Choosing the right tools depends on the type of data, business goals, and team skills is required.
During the data collection phase tools like Google Analytics, Apache Kafka, and SQL-based platforms are mostly used. They help gather structured and unstructured data from different sources.
There are different tools mentioned in the table given below according to the data analytics lifecycle phase and everything is there at one space to understand most of the things properly.
| Lifecycle Phase | Commonly Used Tools (2025) |
|---|---|
| 1. Data Discovery | Google Analytics, Apache Kafka, Mixpanel, Snowflake, Microsoft Azure Data Explorer |
| 2. Data Preparation | Excel, Power Query, Alteryx, Python (Pandas, NumPy), Talend, Trifacta |
| 3. Data Modeling | Python (Scikit-learn, TensorFlow), R, RapidMiner, SAS, IBM SPSS, BigML |
| 4. Model Evaluation | Jupyter Notebook, Google Colab, MLflow, RStudio, TensorBoard |
| 5. Data Visualization | Tableau, Power BI, Google Data Studio, Looker, QlikView |
| 6. Deployment | Apache Airflow, AWS SageMaker, Azure Machine Learning, Databricks, Docker |
| 7. Monitoring & Feedback | Kibana, Grafana, Prometheus, MLflow, DataDog, Apache Superset |
Why Is The Data Analytics Lifecycle Important?
The data analytics lifecycle is important because it brings a clear process to how we work with data. It guides teams through each step. This prevents mistakes and helps everyone stay on the same page.
It starts by keeping work organized. When teams follow a structured flow, they save time and reduce confusion. This also helps in setting clear goals before starting any analysis.
Another reason is data quality. The lifecycle includes stages that focus on cleaning and preparing data. Clean data leads to better insights and more accurate results.
This process also makes it easier for different teams to work together. Business users, analysts, and engineers all understand their roles. Each phase supports teamwork and better communication.
The lifecycle saves time too. Many steps can be automated using modern tools. This allows teams to focus on insights instead of manual work.
Most of all, it improves decision-making. With each step done properly, businesses can trust their results. They can make smarter choices and respond faster to change.
In today’s world, data is everywhere. That is why the data analytics lifecycle is more important than ever. It brings structure and clarity to the data journey and helps turn raw information into real value
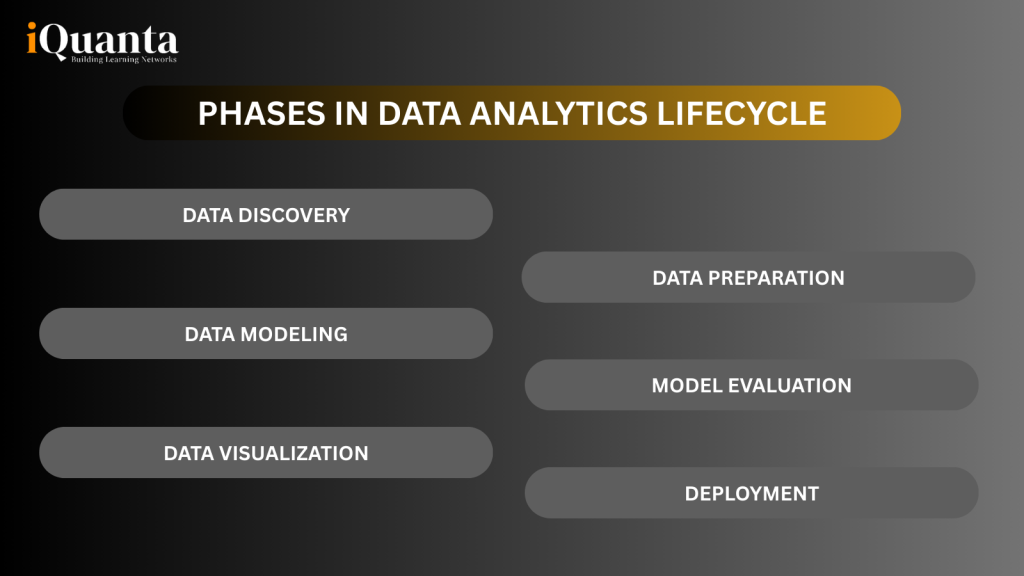
Phases of The Data Analytics Lifecycle
The data analytics lifecycle includes six different phases. Each phase plays a unique role in turning raw data into useful insights. Let us look at each one step by step.
Data Discovery
This is the first phase. Here is the goal to understand the business problems and identify data sources. Analysts collect as much information as possible about the issue and define what they need from the data. This step sets the direction for the entire project.
Data Preparation
In this phase raw data is cleaned and structured. Duplicate entries, missing values, and errors are fixed. The data is also transformed into a format that tools and models can understand. This is one of the most time consuming and important part of the lifecycle.
Data Modeling
Now, analysts apply statistical models or machine learning algorithms to the prepared data. These models help find trends and patterns. Choosing the right model depends on the problem, the data type, and the desired outcome.
Model Evaluation
Once the model is built, it needs to be tested. In this phase, teams check how well the model performs. If the results are not accurate, the model is adjusted or replaced. This ensures quality and trust in the analysis.
Data Visualization
Here, results are turned into visuals like charts, graphs, or dashboards. Tools like Tableau or Power BI make complex data easy to understand. This helps decision-makers see the full picture clearly.
Deployment
This phase puts the model or insight into action. It may involve creating dashboards, sending reports, or connecting models with apps or systems. The goal is to use the insights in real-time decision-making.
Monitoring and Feedback
After deployment, results are tracked over time. Feedback is collected to improve the process. If anything goes wrong, the model is updated. This phase keeps the cycle running smoothly.
| Phase | Objective | Tools Used |
|---|---|---|
| 1. Data Discovery | Understand the business problem and identify data sources. | Google Analytics, SQL, Apache Kafka |
| 2. Data Preparation | Clean, organize, and transform raw data for analysis. | Excel, Alteryx, Power Query, Python (Pandas) |
| 3. Data Modeling | Apply statistical or machine learning models to identify patterns. | Python (Scikit-learn), R, TensorFlow |
| 4. Model Evaluation | Validate model performance to ensure accuracy and reliability. | Jupyter Notebook, MLflow, RStudio |
| 5. Data Visualization | Present data insights through charts, graphs, or dashboards. | Tableau, Power BI, Looker |
| 6. Deployment | Deploy the model for real-time use and decision-making. | Apache Airflow, AWS SageMaker, Databricks |
| 7. Monitoring & Feedback | Continuously track performance and refine the process based on feedback. | Kibana, Grafana, Prometheus, Apache Superset |
Challenges In The Data Analytics Lifecycle
While the data analytics lifecycle helps bring structure but it also comes with some common challenges. Each phase has its own set of challenges that teams need to overcome.
Poor Data Quality
Bad data leads to poor outcomes. Missing values and wrong entries can affect results. Cleaning the data takes time and effort.
Lack of Clear Goals
Sometimes teams start without a clear business question. Without defined goal the entire process can lose direction. This wastes both time and resources.
Tool and Skill Gaps
Every phase needs different tools and skills. Not every team has access to the right technology or trained people. This slows down progress and limits success.
Data Privacy and Security
Handling sensitive data requires strict control. If proper security steps are not followed, data leaks or legal issues can happen. Privacy laws like GDPR must also be considered.
Scalability Issues
As data grows, systems must scale. Not all tools or workflows can handle large volumes. This leads to delays and performance issues.
FAQs (Data Analytics Lifecycle)
What is the data analytics lifecycle?
Data analytics lifecycle is a structured step-by-step process to collect, analyze, clean and monitor data but also convert meaningful data into useful terms.
How many phases are there in the data analytics lifecycle?
There are seven phases here which includes data discovery, data preparation, data modeling, model evaluation, data visualization, deployment and modeling.
Why is the data analytics important?
It brings structure to data projects. It improves data quality, supports better decisions, and ensures teams follow the same path.
What tools are used in data analytics lifecycle?
Common tools include Excel, Python, SQL, Tableau, Power BI, R, AWS, and Apache Spark. The choice depends on the phase and project needs. Even small teams can follow the lifecycle. It helps manage data better and make smarter decisions.


