
When we talk about predicting numbers using machine learning, most people think about linear regression. But there is another easy and powerful method called Decision Tree Regression. It works just like how we make choices in real life by asking one question at a time.
A decision tree does the same thing but with data. It keeps asking questions like Is this value greater than that? and based on the answers, it moves in a certain direction. It keeps doing this until it finds the best answer.
The best part is that it does not need the data to follow any straight pattern. It just finds the best splits in the data to make predictions. You can use it to guess house prices, sales numbers, stock values, and more. In this blog, we will understand how decision tree regression works and how you can use it easily in Python.
What is Decision Tree Regression?
Decision Tree Regression is a machine learning method that helps us predict numbers like house prices, temperature, or sales. It works by breaking the data into smaller and smaller parts using questions. For example it might ask if the area of a house is more than 1000 square feet. If yes then it goes one way. If not, it goes another way.
This process continues until the model reaches a final value that it thinks is the best prediction. It is called a tree because the process looks like a tree with branches. Each question is like a branch that leads to more branches or a final answer. Unlike some models that draw a straight line through the data, this one just focuses on making simple decisions that are easy to follow. This makes it a great choice when your data does not follow any clear pattern or line and still needs accurate number predictions.

How Does Decision Tree Regression Work?
Decision Tree Regression works by asking a series of questions to split the data into smaller parts. It starts with the entire dataset and tries to find the best question that divides the data into two groups where the values are more similar within each group. This question is usually based on one of the features like price, size, or age.
After the first split it keeps asking more questions inside each group and continues splitting until the groups are small enough or cannot be split further. At the end of each path, it gives a final number as the prediction. This number is usually the average of the values in that group. The tree keeps growing like this, and every step helps the model get more accurate.
import numpy as np
import matplotlib.pyplot as plt
from sklearn.tree import DecisionTreeRegressor
from sklearn.datasets import make_regression
# Generate sample data
X, y = make_regression(n_samples=100, n_features=1, noise=15, random_state=42)
X = np.sort(X, axis=0)
# Fit Decision Tree Regressor
model = DecisionTreeRegressor(max_depth=4)
model.fit(X, y)
# Predict
X_test = np.linspace(X.min(), X.max(), 300).reshape(-1, 1)
y_pred = model.predict(X_test)
# Plotting
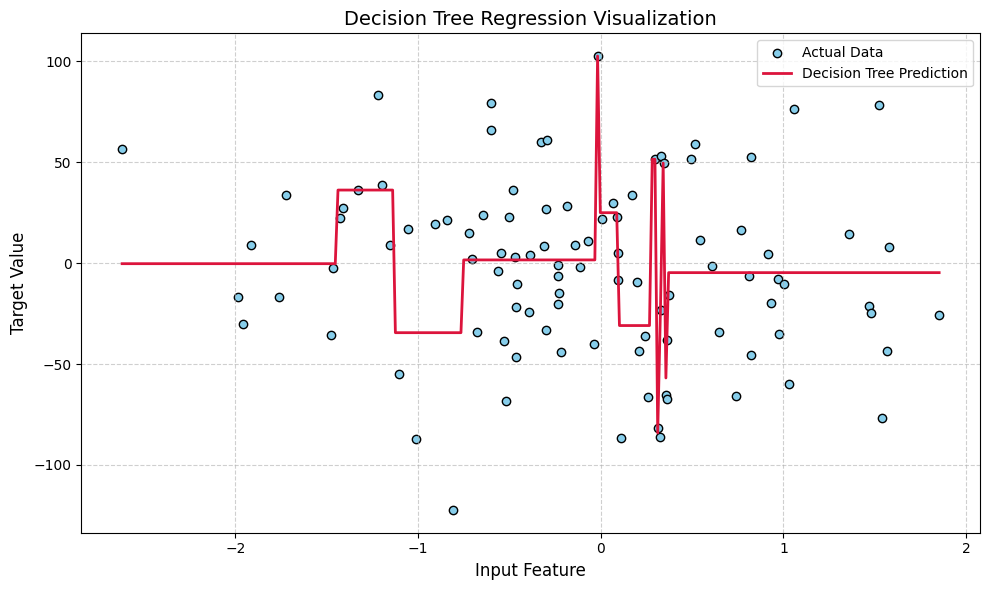
plt.figure(figsize=(10, 6))
plt.scatter(X, y, color='skyblue', label='Actual Data', edgecolor='black')
plt.plot(X_test, y_pred, color='crimson', linewidth=2, label='Decision Tree Prediction')
plt.title('Decision Tree Regression Visualization', fontsize=14)
plt.xlabel('Input Feature', fontsize=12)
plt.ylabel('Target Value', fontsize=12)
plt.legend()
plt.grid(True, linestyle='--', alpha=0.6)
plt.tight_layout()
plt.show()
Key Concepts in Decision Tree Regression

- Root Node
This is where the decision tree starts. It holds the entire dataset and begins the first split. - Decision Node
These are the points where the tree makes decisions or asks questions to split the data. - Leaf Node
These are the final nodes that give the prediction values. They don’t split any further. - Splitting
The process of dividing the data into smaller groups based on a certain condition or question. - Mean Squared Error (MSE)
A score used to measure how wrong the predictions are. The lower it is, the better the split. - Tree Depth
The number of levels or layers in the tree. Deeper trees can fit the data better but may also overfit. - Pruning
A technique used to cut down the size of the tree and remove unnecessary splits to avoid overfitting. - Overfitting
When the tree learns the training data too well, including noise, and performs poorly on new data. - Greedy Algorithm
The decision tree uses a greedy method which means it picks the best split at each step without looking ahead. - Feature Importance
Decision trees can also tell which features (columns) are most useful for making predictions.
Decision Tree Regression vs Linear Regression
| Feature | Decision Tree Regression | Linear Regression |
| Prediction Type | Predicts by splitting data into parts | Predicts by drawing a straight line |
| Works with Non-linear Data | Yes, works well | No, only works well with straight-line data |
| Easy to Understand | Yes | Yes |
| Needs Feature Scaling | No | Sometimes yes |
| Handles Missing Data | Can handle it | Not easily |
| Overfitting Risk | High if not controlled | Less likely |
| Output Style | Gives step-like predictions | Gives smooth predictions |
| Performance on Complex Data | Good for messy data | Not so good |
| Visual Representation | Looks like a flowchart tree | Looks like a straight line |
Python Implementation of Decision Tree Regression
import numpy as np
import matplotlib.pyplot as plt
from sklearn.tree import DecisionTreeRegressor
from sklearn.datasets import make_regression
X, y = make_regression(n_samples=100, n_features=1, noise=10, random_state=42)
model = DecisionTreeRegressor(max_depth=3)
model.fit(X, y)
X_test = np.linspace(X.min(), X.max(), 300).reshape(-1, 1)
y_pred = model.predict(X_test)
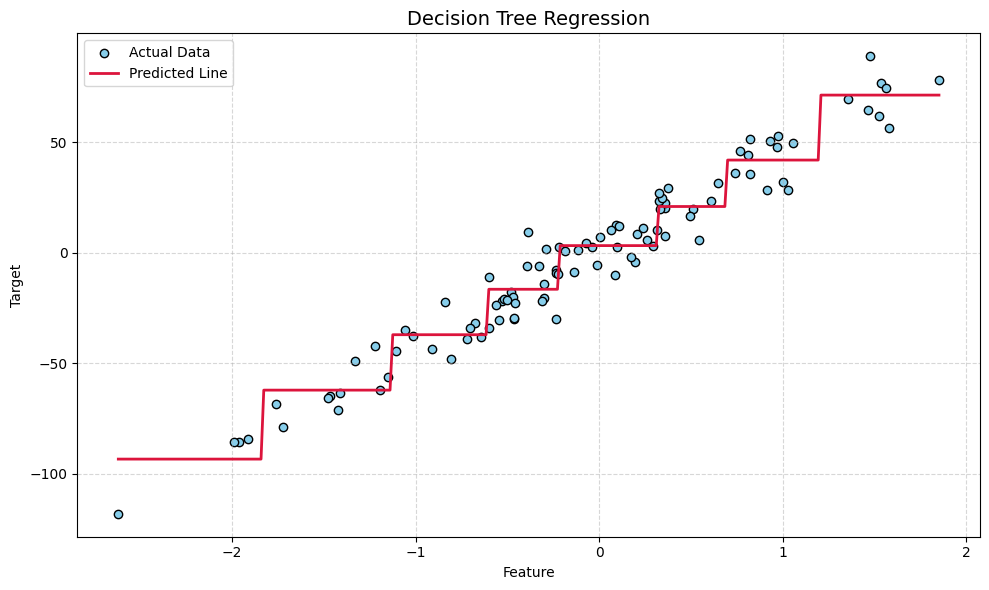
plt.figure(figsize=(10, 6))
plt.scatter(X, y, color='skyblue', edgecolor='black', label='Actual Data')
plt.plot(X_test, y_pred, color='crimson', linewidth=2, label='Predicted Line')
plt.title('Decision Tree Regression', fontsize=14)
plt.xlabel('Feature')
plt.ylabel('Target')
plt.legend()
plt.grid(True, linestyle='--', alpha=0.5)
plt.tight_layout()
plt.show()
Advantages of Decision Tree Regression
- Easy to understand and explain because it works like asking simple questions step by step.
- Can handle both numbers and categories, so it works well with different types of data.
- No need to scale or normalize the data, which saves time and effort.
- Handles missing values better than many other models.
- Can model complex relationships in the data that are not straight lines.
- Works well even if the data is not perfectly clean or follows no clear pattern.
- Fast to train and predict, especially for small to medium-sized datasets
Disadvantages of Decision Tree Regression
- Decision trees can easily overfit meaning they learn the training data too well and do poorly on new data.
- Small changes in the data can cause big changes in the tree, making it unstable sometimes.
- Not the best choice for very large datasets because the tree can become very big and slow.
- Can give less accurate results compared to other advanced models like Random Forest or Gradient Boosting.
- Needs careful tuning of parameters like tree depth or minimum samples per leaf to avoid overfitting or underfitting.
- Sometimes the step like predictions may not be smooth enough for certain problems.

Applications of Decision Tree Regression
- House Price Prediction: Helps estimate the price of a house based on features like size, location, and number of rooms.
- Sales Forecasting: Used to predict future sales by analyzing past sales data and market trends.
- Crop Yield Estimation: Assists farmers by predicting how much crop they might produce based on weather, soil, and other factors.
Conclusion
Decision Tree Regression is a powerful and easy-to-understand tool for predicting numbers. It works by asking simple yes or no questions to split data into groups and then predicts values based on those groups. It is great for handling complex data that does not follow a straight line. However, it can sometimes learn too much from training data and not perform well on new data if not carefully controlled. Overall it is a useful method to have in your machine learning toolkit especially when you want clear and interpretable predictions.
Frequently Asked Questions
What is the main difference between decision tree regression and classification?
Decision tree regression is used to predict continuous numeric values, like prices or temperatures. On the other hand, decision tree classification predicts categories or labels, such as “spam” or “not spam.” So regression deals with numbers, while classification deals with groups.
Can decision tree regression handle missing data?
Yes, decision trees can handle missing data better than many other models. They do this by making splits based on available information and can sometimes skip missing values during the decision process, making them more flexible with incomplete data.
How do I avoid overfitting in decision tree regression?
Overfitting happens when the tree learns the training data too perfectly, including noise, which makes it perform poorly on new data. To avoid this, you can limit the depth of the tree, set a minimum number of samples required to split a node, or use pruning techniques to cut unnecessary branches.

Is decision tree regression better than linear regression?
It depends on your data. Decision tree regression works better for complex and non-linear data where relationships between features and targets are not straight lines. Linear regression is simpler and works well when data follows a linear pattern.
Can decision tree regression be used for real-time predictions?
Yes, decision trees are generally fast at making predictions, so they can be used for real-time applications, especially when the dataset is not too large or complex.


