
Time series analysis is a hot topic these days because predicting the future is no longer a luxury but it is a necessity. Whether it is forecasting stock prices, predicting weather patterns or estimating product demand. Time series analysis is an important concept across industries. At its core, time series analysis is a method of analyzing data points collected or recorded at a specific time interval to uncover different patterns, trends or variations.
What makes time series data unique in nature. Unlike random datasets, time series data respects the order of time, which means with the help of past values or data, we can predict future outcomes. That’s why it is majorly used in different domains like finance, healthcare, marketing and operations. In this blog, we will talk about the essential components, techniques, tools and real-world applications of time series analysis. So, whether you are a beginner or looking to improve your skills then this blog will help you to master time series forecasting in detail.

Components of Time Series Analysis
To understand the concept of time series analysis, you first need to break down its major components. Just think of a time series like a movie where each component plays a unique role in telling the full story of how the data should behave over time.
Trend
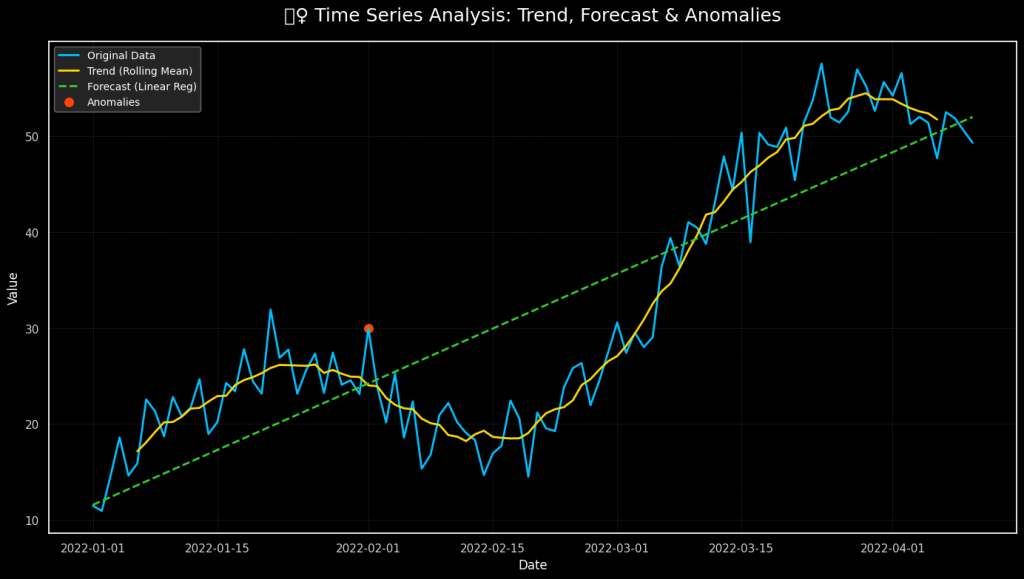
The Trend is the first component of time series analysis that refers to the overall direction of data over a long period of time. It shows whether the values are increasing, decreasing or staying consistent with time. For example, if an organization’s sales have been rising over the period of the past five years, that indicates an upward trend. Trends usually don’t change that quickly because it reflects the long-term growth or decline in a dataset whatever will be there. Identification of the trend helps analysts understand the general progress of a variable and make informed decisions.
Seasonality
Seasonality is another component of time series analysis that refers to the repetition of patterns or cycles of data that occur at regular time intervals such as daily, weekly, monthly or yearly.
These patterns are covered by seasons, holidays, events or other factors. For example, sales of wooden clothes are usually in demand during winter and drop during the summer. Seasonality is predictable and helps businesses prepare for fluctuations by adjust multiple domains like marketing, inventory or staffing.

Cyclicality
Cyclicality means the data goes up and down over time, but not in a regular or fixed pattern like seasonality. These ups and downs usually happen because of big factors like changes in the economy or business conditions. For example, when house prices rise for a few years and then fall for a while, that’s a cycle. These changes can last for many years and don’t happen at the same time every year. Unlike seasonality, which is predictable, cycles are harder to spot because they depend on things like market trends or economic growth.
Irregularity
Irregularity is the component of the time series analysis which is also called noise or variation. It refers to random changes in the data that don’t follow any pattern. These are done by unpredictable events like natural disasters, or sudden system failures.
For example: a sudden drop in airline passengers due to a global pandemic issue and this is considered as irregularity in time series analysis. It is impossible to predict irregularities, and helps avoid irregular conclusions and ensures more accurate forecasting models.
Time Series vs Other Data Types
Time series analysis is a field in data science and statistics that focuses on data collection over time intervals. When you are performing time series analysis, you are dealing with unique methods and challenges that do not apply on other data types. Time series data is different from other types of data because it is collected over time and each data point is linked to a specific date or time. In time series analysis, the order of the data is very important, as past values can influence future outcomes.
This is not the case with regular tabular data, where the order of rows doesn’t matter, and each record is usually independent. Time series focuses on patterns like trends, seasonality, and cycles, which happen over time and help in forecasting future values. For example, daily temperature readings or monthly sales figures are time series data. On the other hand, a dataset containing student test scores or product details does not involve time-based patterns and is analyzed differently. Time series analysis uses unique techniques such as lag features, moving averages, and stationarity checks, which are not needed in other types of data analysis.
Techniques of Time Series Analysis
Time Series Analysis covers a variety of techniques that help identify patterns, trends and structures within the data. These methods are essential for building reliable forecasting models. Below are some of the most commonly used techniques:
Data Visualization
Data visualization is the first step in time series analysis. Line plots help you quickly spot trends, seasonal patterns, or unusual spikes in the data. Visualization provides a clear picture of the time-based behavior, making it easier to decide what kind of model or transformation might be needed.

Decomposition
Decomposition breaks a time series into three parts: trend, seasonality, and residuals. This helps isolate and understand different patterns in the data. By separating these components, analysts can study each one individually and improve forecasting accuracy by building models tailored to specific behaviors in the dataset.
Stationary Testing
Stationarity means the statistical properties of a time series like mean and variance that remain constant over time. Many models assume stationarity. Techniques like the Augmented Dickey-Fuller (ADF) test are used to check for it. If data isn’t stationary, differencing or transformations are applied to stabilize the series.
Autocorrelation
Autocorrelation measures how current data points relate to their past values. It helps identify repeating patterns and the influence of previous time steps. ACF (Autocorrelation Function) and PACF (Partial Autocorrelation Function) plots guide model selection by showing how far back the data “remembers” past values.
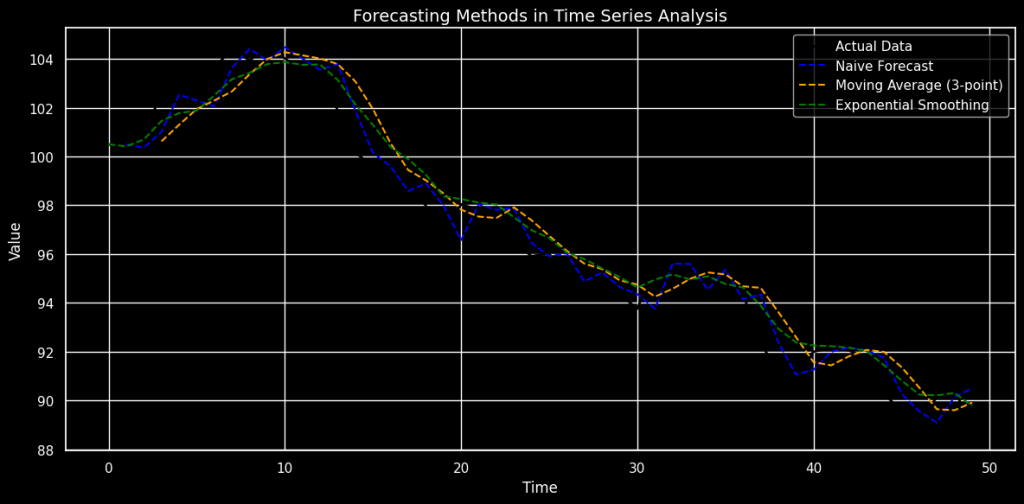
Smoothing Techniques
Smoothing reduces random noise in time series data to highlight meaningful trends. Common techniques include simple moving averages and exponential smoothing. These methods are especially useful when trying to understand overall direction or make short-term forecasts based on past behavior without being distracted by irregular spikes.
Feature Engineering
Feature engineering in time series involves creating useful input features from raw data. This includes lag values, rolling statistics, and date-time features like day of week or month. These features improve the performance of machine learning models by capturing patterns and dependencies that basic data might miss.
Forecasting Methods in Time Series Analysis
ARIMA (AutoRegressive Integrated Moving Average)
ARIMA is a classic statistical model used when the data shows no seasonality but may have trends. It combines three ideas:
- AutoRegression (AR): Uses past values.
- Integration (I): Applies differencing to make data stationary.
- Moving Average (MA): Uses past forecast errors.
It’s ideal for stable, unseasonal time series.
SARIMA (Seasonal ARIMA)
SARIMA extends ARIMA by adding seasonal components. It models data with repeating cycles, such as monthly sales or temperature trends. By handling both trend and seasonality, SARIMA is great for datasets where patterns repeat regularly. It’s especially useful in retail, weather, and electricity demand forecasting.

Exponential Smoothing (ETS)
ETS stands for Error, Trend, and Seasonality. This method applies more weight to recent observations, making it responsive to recent changes in the data. It works well for short-term forecasts and is often easier to implement than ARIMA. Variants like Holt-Winters are popular for seasonal data.
Prophet (by Facebook)
Facebook Prophet is a modern forecasting tool built for business time series data. It handles holidays, seasonality, and trend changes automatically. It’s known for being user-friendly and accurate, especially when there are sudden shifts in trends. Prophet is ideal for marketers, analysts, and data scientists.
LSTM (Long Short-Term Memory Networks)
LSTM is a type of deep learning model specially designed for sequence data like time series. It captures long-term dependencies better than traditional models. LSTM is useful for complex datasets with non-linear patterns, such as stock prices or sensor readings, but it requires more data and computing power.
Tools and Libraries
| Tool / Library | Language | Use Case / Purpose |
| Pandas | Python | Data manipulation, time indexing, resampling, and cleaning |
| NumPy | Python | Numerical operations, array handling |
| Matplotlib / Seaborn | Python | Data visualization and plotting time series |
| Statsmodels | Python | Statistical models like ARIMA, ADF test, decomposition |
| Scikit-learn | Python | Machine learning models and preprocessing |
| Facebook Prophet | Python / R | Easy-to-use time series forecasting with trend + seasonality |
| TensorFlow / Keras | Python | Deep learning models like LSTM for complex patterns |
| XGBoost / LightGBM | Python | Tree-based models for structured time series forecasting |
| PyCaret (Time Series) | Python | Low-code time series modeling and comparison |
| R (forecast, tseries) | R | Classical models (ARIMA, ETS), stationarity tests |
| Plotly | Python / R | Interactive time series visualizations |
| Darts | Python | Unified framework for classical + deep learning models |
Step-by-Step Forecasting Pipelines in Time Series Analysis
| Step | Stage | Description |
| 1 | Data Collection | Gather time-stamped data at consistent intervals (daily, monthly, etc.). |
| 2 | Data Cleaning | Handle missing values, duplicates, and convert time columns to datetime format. |
| 3 | Data Visualization | Plot the data to detect trends, seasonality, and outliers. |
| 4 | Decomposition | Break the data into trend, seasonal, and residual components. |
| 5 | Stationarity Testing | Check if data is stationary using ADF/KPSS tests; apply differencing if needed. |
| 6 | Feature Engineering | Create lag features, rolling averages, and date-based features. |
| 7 | Train-Test Split | Split the data chronologically for model training and validation. |
| 8 | Model Selection | Choose a model: ARIMA, SARIMA, Prophet, LSTM, XGBoost, etc. |
| 9 | Model Training & Tuning | Train the model and fine-tune parameters for better accuracy. |
| 10 | Forecasting | Predict future values using the trained model. |
| 11 | Evaluation | Measure accuracy using MAE, RMSE, or MAPE. |
| 12 | Visualization of Results | Plot actual vs predicted values to assess model performance. |
Conclusion
Time series analysis is a powerful technique to understand and predict how data changes over time. By breaking down a time series data into components like trend, irregularity, and seasonality and using right forecasting methods helps you to make accurate future predictions.
Whether you are working with sales data, stock prices, weather trends or any time-stamped information, it will give you deeper insights and more reliable results. So, with the right tools and techniques and a bit of practice, time series forecasting can unlock opportunities for businesses and researchers.

FAQs
What is time series analysis used for?
Time series analysis is used to analyze data collected over time to identify patterns like trends and seasonality to make forecasts. It is commonly applied in fields like finance, weather forecasting, sales prediction, and energy consumption.
How is time series different from regular data analysis?
Time series data depends on time order where each point is linked to a specific timestamp, and past values often influence future ones. In regular data analysis, rows are often independent and not time-based.
Which models are best for time series forecasting?
Popular models include ARIMA, SARIMA, Facebook Prophet, and LSTM. The best model depends on your data’s characteristics like seasonality, trend, and complexity.
Do I need to make my data stationary?
Yes, many time series models like ARIMA require the data to be stationary. If it’s not, techniques like differencing or log transformation are used to make the data stable.
Can machine learning models be used for time series forecasting?
Yes models like XG Boost, Random forest and LSTM uses time series analysis.


