")
Random forest regression is a popular and powerful machine learning technique used for predicting continuous values like prices, sales, and temperatures. It is based on the idea of building not just one decision tree but many of them and then combining their results to get a more accurate and stable prediction.
Each tree gives its own prediction, and the final answer is usually the average of all those predictions. This method helps reduce errors and avoids overfitting, which can happen with a single decision tree. Random forest regression is used in many real-world problems such as stock market forecasting, house price prediction, and even medical research.
What makes it special is that it works well even when the data is messy or has missing values. In this blog, we will explore how random forest regression works and understand its main advantages and disadvantages in a simple and beginner-friendly way.

What is Random Forest Regression?
Random forest regression is a smart and widely-used machine learning method. It helps predict continuous values like house prices, temperatures, or sales numbers. Instead of relying on just one decision tree, it builds many of them. Then, it combines their results to make a final prediction. This approach makes the model more accurate and less likely to make mistakes.
Each tree in the forest learns from different parts of the data. Because of that, random forest handles noise and missing values better than most models. It also reduces the chances of overfitting, which often happens with a single decision tree.
Thanks to its reliability, many industries use random forest regression today. For example, it helps in real estate pricing, stock market predictions, and even medical diagnosis. In this blog, we’ll explore how it works, where it shines, and also when it might not be the best fit.
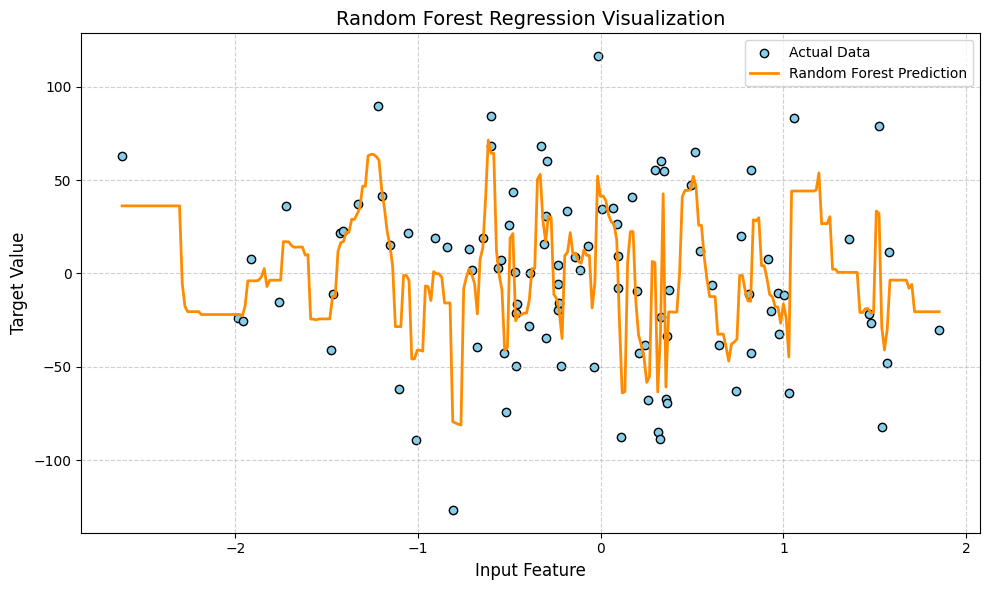
import numpy as np
import matplotlib.pyplot as plt
from sklearn.ensemble import RandomForestRegressor
from sklearn.datasets import make_regression

X, y = make_regression(n_samples=100, n_features=1, noise=20, random_state=42)
X = np.sort(X, axis=0)

model = RandomForestRegressor(n_estimators=100, random_state=42)
model.fit(X, y)

X_test = np.linspace(X.min(), X.max(), 300).reshape(-1, 1)
y_pred = model.predict(X_test)

plt.figure(figsize=(10, 6))
plt.scatter(X, y, color='skyblue', label='Actual Data', edgecolor='black')
plt.plot(X_test, y_pred, color='darkorange', linewidth=2, label='Random Forest Prediction')
plt.title('Random Forest Regression Visualization', fontsize=14)
plt.xlabel('Input Feature', fontsize=12)
plt.ylabel('Target Value', fontsize=12)
plt.legend()
plt.grid(True, linestyle='--', alpha=0.6)
plt.tight_layout()
plt.show()
How Does Random Forest Regression Works?
Random forest works by building a group of decision trees instead of just one. Each tree is trained on a random part of the dataset, not the whole thing. This is called “bootstrapping.” The idea is that by using many small and slightly different trees, the final result becomes more stable and accurate.
Each tree in the forest gives its own prediction. The model then takes the average of all those predictions to make the final output. Because it mixes multiple trees, it reduces the chances of making a big mistake that a single tree might make.

Also, when growing each tree, it doesn’t use all the features at once. It picks a random set of features, which adds more variety and avoids overfitting. In short random forest combines the power of many weak models to make one strong and reliable prediction.
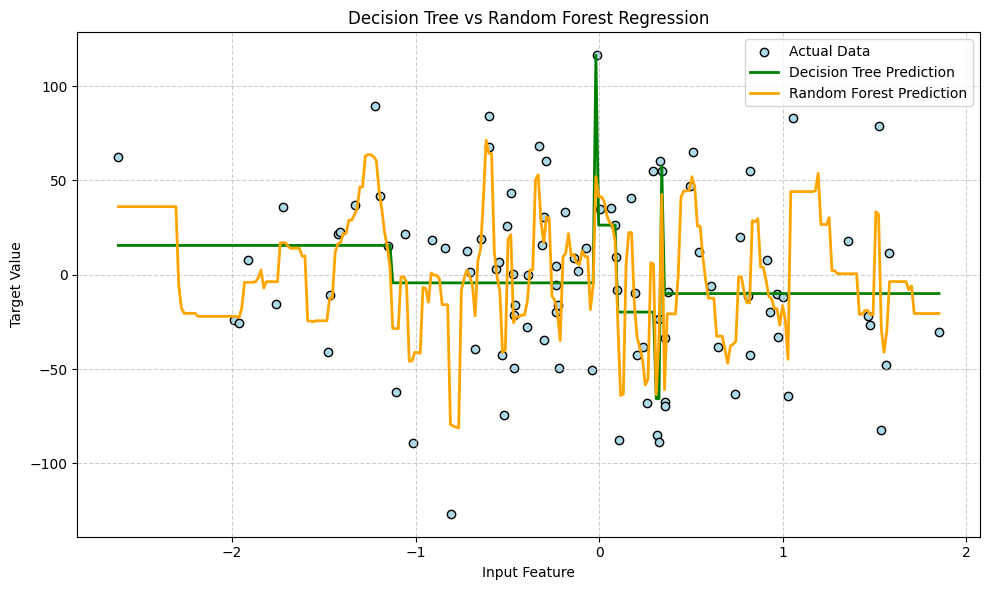
import numpy as np
import matplotlib.pyplot as plt
from sklearn.tree import DecisionTreeRegressor
from sklearn.ensemble import RandomForestRegressor
from sklearn.datasets import make_regression

X, y = make_regression(n_samples=100, n_features=1, noise=20, random_state=42)
X = np.sort(X, axis=0)

dt_model = DecisionTreeRegressor(max_depth=3)
rf_model = RandomForestRegressor(n_estimators=100, random_state=42)

dt_model.fit(X, y)
rf_model.fit(X, y)

X_test = np.linspace(X.min(), X.max(), 300).reshape(-1, 1)
y_pred_dt = dt_model.predict(X_test)
y_pred_rf = rf_model.predict(X_test)

plt.figure(figsize=(10, 6))
plt.scatter(X, y, color='lightblue', label='Actual Data', edgecolor='black')
plt.plot(X_test, y_pred_dt, color='green', linewidth=2, label='Decision Tree Prediction')
plt.plot(X_test, y_pred_rf, color='orange', linewidth=2, label='Random Forest Prediction')
plt.title('Decision Tree vs Random Forest Regression')
plt.xlabel('Input Feature')
plt.ylabel('Target Value')
plt.legend()
plt.grid(True, linestyle='--', alpha=0.6)
plt.tight_layout()
plt.show()
Python Implementation of Random Forest Algorithm in ML
import numpy as np
import matplotlib.pyplot as plt
from sklearn.datasets import fetch_california_housing
from sklearn.ensemble import RandomForestRegressor
from sklearn.model_selection import train_test_split
from sklearn.metrics import mean_squared_error, r2_score

data = fetch_california_housing()
X, y = data.data, data.target

X_train, X_test, y_train, y_test = train_test_split(X, y, test_size=0.2, random_state=42)

model = RandomForestRegressor(n_estimators=100, random_state=42)
model.fit(X_train, y_train)

y_pred = model.predict(X_test)

mse = mean_squared_error(y_test, y_pred)
r2 = r2_score(y_test, y_pred)

print(f"Mean Squared Error: {mse:.2f}")
print(f"R² Score: {r2:.2f}")

plt.figure(figsize=(10, 6))
plt.scatter(y_test, y_pred, color='purple', alpha=0.5)
plt.plot([min(y_test), max(y_test)], [min(y_test), max(y_test)], color='black', linestyle='--')
plt.xlabel('Actual Prices')
plt.ylabel('Predicted Prices')
plt.title('Actual vs Predicted Prices (Random Forest Regression)')
plt.grid(True, linestyle='--', alpha=0.6)
plt.tight_layout()
plt.show()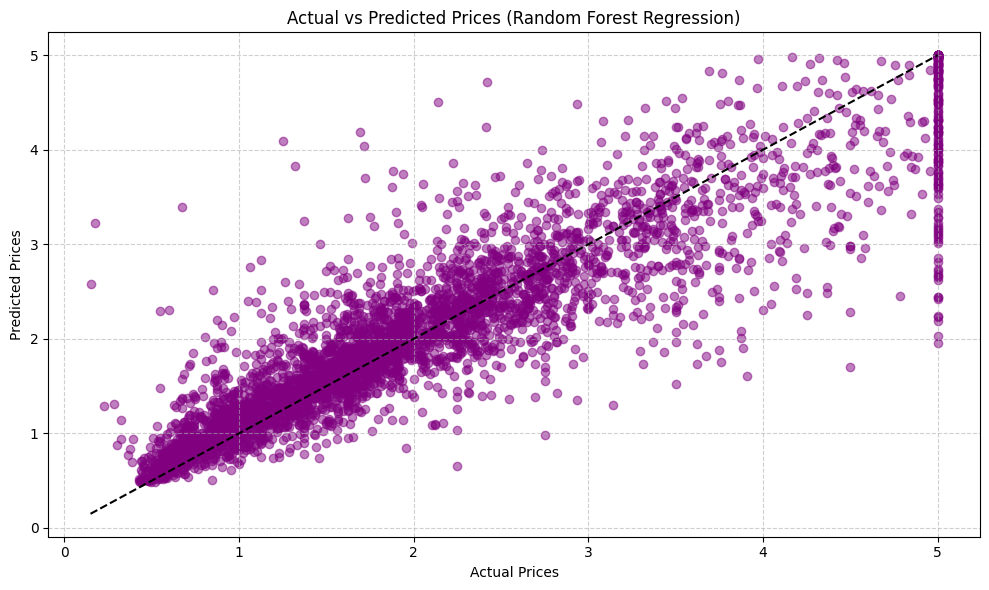
Advantages of Random Forest
- It can understand complicated data that is not simple or straight.
- It does not get tricked easily by training data mistakes.
- It works well even with lots of data and many features.
- It still works well when some data is missing or strange.
- It tells you which things are most important for making predictions.

Disadvantages of Random Forest Regression
- It can be slow to train and predict when there are many trees and lots of data.
- The model can become very big and use a lot of computer memory.
- It is harder to understand compared to simple models like linear regression.
- Sometimes it overfits if trees are too deep or too many trees are used.
- It may not work well on very small datasets because it needs enough data to build many trees.
Applications of Random Forest Regression
- Predicting house prices using features like size and location.
- Forecasting stock prices based on past market data.
- Helping doctors predict health outcomes from patient info.
- Predicting weather like temperature and rainfall.
- Estimating future sales to help businesses plan better.
Conclusion
Random Forest Regression is a powerful and popular tool for predicting numbers. It works by combining many decision trees to make better and more accurate predictions. It handles complex data well and is less likely to make big mistakes compared to single trees. Plus, it can deal with missing data and helps you understand which features matter most. While it can be a bit slow and hard to interpret, its advantages often outweigh the drawbacks. Whether you want to predict house prices, stock trends, or weather, Random Forest is a great choice to try. Learning how to use it can really boost your skills in machine learning and data science.
Frequently Asked Questions
What is Random Forest?
Random Forest Regression is a machine learning method that uses many decision trees to predict continuous values. It combines the predictions of multiple trees to improve accuracy and reduce errors compared to using just one tree.
How is Random Forest different from Decision Tree Regression?
While Decision Tree Regression uses a single tree to make predictions, Random Forest builds many trees on random parts of the data and averages their results. This makes Random Forest more stable and less likely to overfit.
Can Random Forest Regression handle missing data?
Yes, Random Forest is quite robust and can handle missing data better than many other models. It can still make good predictions even if some values in the dataset are missing.

What are some common uses of Random Forest Regression?
It is commonly used in fields like real estate for house price prediction, finance for stock forecasting, healthcare for medical diagnosis, weather forecasting, and sales prediction.
Does Random Forest Regression require a lot of data?
Random Forest performs best when there is enough data to build multiple diverse trees. It may not be very effective with very small datasets.


